Why Most Traders Miss the Liquidity Sweep Setup
Most retail traders see a sharp move down and call it capitulation. They wait for a reversal that never comes. What they miss is the structural story that preceded the move - specifically, where liquidity was sitting and how institutions swept it before committing to directional intent. The liquidity sweep is not a reversal pattern. It is a continuation trigger that confirms which side of the market holds structural control.
The setup begins with a single question: where is the nearest cluster of stops sitting? In a downtrending structure, that liquidity sits above the most recent structural high - the high that broke the prior fractal low and established the current bearish sequence. When price sweeps that high and rejects it with a heavy momentum candle, you have institutional confirmation. They have collected liquidity and are now positioned for continuation.
This is not a discretionary read. It is a mechanical framework built on fractal structure and momentum candle mechanics, the same principles that define the Catch The Wick™ 2-candle entry model.
Identifying the Structural High That Matters
Not every high qualifies as a liquidity sweep target. The high that matters is the one that broke the most recent fractal low and established the current downward bias. This is the pivot that shifted market structure from neutral or bullish to bearish. It is the last point where long positions were trapped, and their stops now sit just above it.
To identify this high, trace your fractal structure backward from the current price. Look for the swing high that preceded the break of the most recent structural low. That high is your liquidity target. When price returns to sweep it, you are watching institutional re-entry. They are not guessing. They are engineering a move by clearing the sell-side liquidity that accumulated above that pivot.
The structural high is not subjective. It is the last high that maintained the prior range before price broke lower. If you are uncertain which high to mark, ask this: which high, if broken, would invalidate the current downtrend? That is your liquidity sweep level.
The Heavy Bearish Momentum Candle as Confirmation
The liquidity sweep itself is only half the setup. The confirmation comes from how price responds after sweeping the high. A heavy bearish momentum candle is your entry signal. This is not a small rejection wick or a doji. It is a full-bodied candle that closes near its low, showing institutional commitment to the downside after liquidity collection.
The characteristics of a valid momentum candle are specific: the body should consume at least 60-70% of the candle's range, the close should be within the lower third of the candle, and the upper wick should be minimal relative to the body. A long upper wick signals contested rejection, not clean continuation. You want a candle that opens, drives down, and closes with minimal hesitation.
This momentum candle is the institutional fingerprint. It tells you they have finished collecting liquidity and are now positioned for the move. The next candle becomes your entry candle, following the 2 Candle. 1 Story.™ framework - the momentum candle sets the bias, the entry candle confirms it.
Trade Execution: Entry, Stop, and Risk
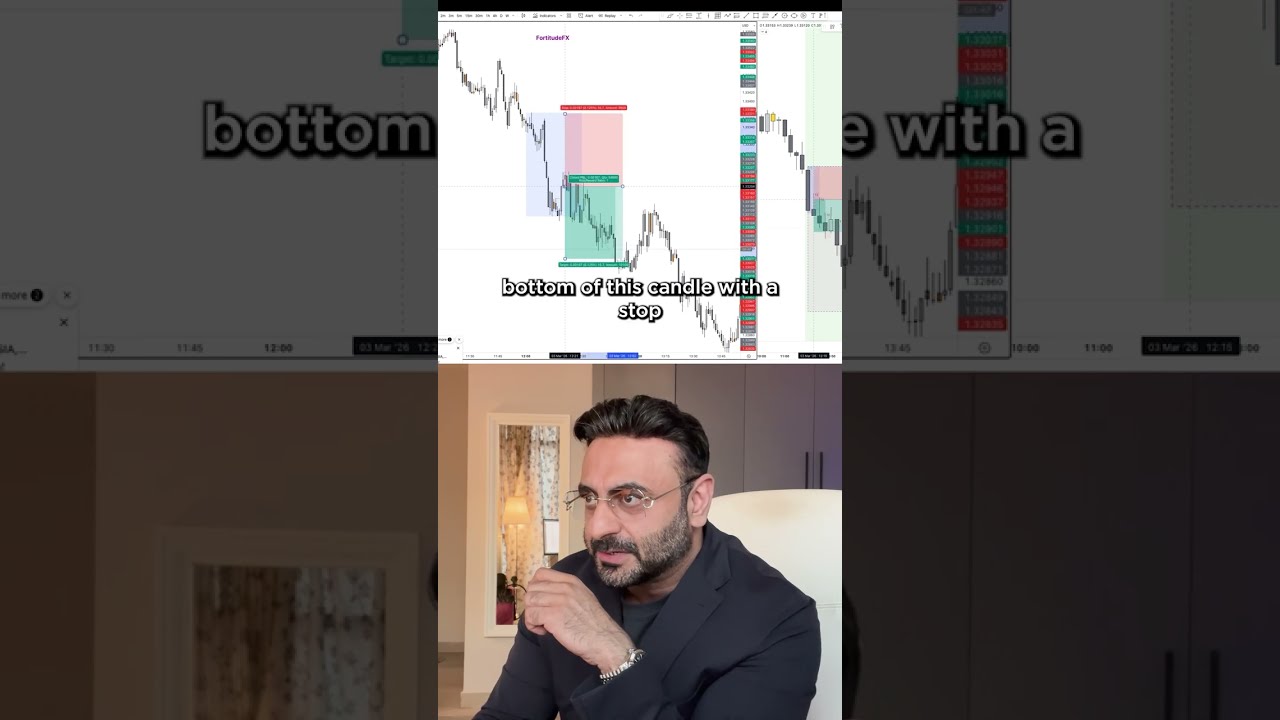
Your short entry is placed at the bottom of the heavy bearish momentum candle. This is the mechanical trigger. You are not entering on the momentum candle itself - you are waiting for confirmation from the next candle's price action. If the following candle opens and moves lower, validating the bearish bias, your entry at the momentum candle's low is filled.
The stop loss sits just above the high of the momentum candle, with a 3.5 to 4 pip buffer depending on the pair's spread and volatility. This buffer accounts for normal price noise without giving the trade excessive room to invalidate. Your stop is not arbitrary - it is structural. If price reclaims the high of the momentum candle, the liquidity sweep has failed and institutional bias has reversed.
Position sizing follows the standard risk management protocol: risk 1-2% of account equity per trade, with the stop loss distance determining position size. A 10-pip stop on a standard lot risks $100. If your account equity is $10,000 and you risk 1%, your position size is 1 standard lot. The risk-to-reward ratio on a liquidity sweep continuation trade regularly exceeds 1:8 to 1:10 when targeting the next structural low or extension zone.
Why This Setup Produces 10R Trades
The asymmetry in this setup comes from entry precision and structural alignment. You are entering at the exact point where institutional positioning is confirmed, with a stop placed just beyond the invalidation level. Your risk is tightly defined - often 8 to 12 pips - while your reward extends to the next major structural target, which can be 80 to 120 pips away in a clean trending environment.
A 10R trade means you risked 10 pips to gain 100 pips. This is not luck. It is structural advantage. The liquidity sweep entry places you in the trade at the origin of the institutional move, not halfway through it. You are not chasing momentum - you are entering with it, at the point of commitment.
The key to realizing this ratio is target selection. Do not exit at arbitrary profit levels. Target the next fractal low, the next liquidity pool, or the next structural zone where opposing interest is likely to enter. Let the structure determine your exit, not your emotions or account balance fluctuations.
Common Mistakes That Kill the Setup
The most frequent mistake is entering on the liquidity sweep itself, before the momentum candle forms. Traders see price spike above the structural high and immediately short the high, assuming rejection is guaranteed. This is guessing. The momentum candle is your confirmation that the sweep was successful and directional bias has been established. Without it, you are trading hope.
The second mistake is using too wide a stop loss. If your stop is 20 or 30 pips above the momentum candle high, you are not trading structure - you are trading fear. The stop should sit just above the high with minimal buffer. If the high is reclaimed, the setup is invalid and you should exit. Holding through invalidation destroys the risk-reward asymmetry that makes this setup profitable.
The third mistake is ignoring timeframe confirmation. A liquidity sweep on the 5-minute chart that conflicts with the 15-minute or 1-hour structure is a lower-probability trade. Align your entry timeframe with the higher timeframe bias. If the 1-hour chart is bearish and the 5-minute chart shows a liquidity sweep with momentum confirmation, you have confluence. If the 1-hour is bullish, the 5-minute sweep is a counter-trend trade with reduced edge.
The Full Breakdown and Next Steps
This setup is part of the broader Catch The Wick™ mechanical entry system, which teaches traders how to identify institutional positioning through price structure, momentum candles, and liquidity dynamics. The liquidity sweep is not a standalone pattern - it is one expression of the 2-candle framework applied to trending markets.
If you want to see this setup broken down in real chart environments with live trade examples, the full video breakdown is now available on the FortitudeFX YouTube channel. You will see how to mark structural highs, identify momentum candles, and execute entries with precision. The video includes multiple trade examples across different pairs and sessions.
For traders ready to learn the complete CTW system and apply it consistently, the FortitudeFX Bootcamp walks through every component of the framework - from fractal structure to session bias to risk management. You will learn how to read charts the way institutional traders do, and how to position yourself ahead of retail reaction.
Join the free FortitudeFX Discord to discuss this setup with other traders, share chart examples, and get feedback on your trade execution. The liquidity sweep is a high-probability setup when executed correctly. Learn the mechanics, respect the structure, and let the edge work for you.